Why can the movement of the NQ change so quickly? 5 things that are worth checking before trading
In this post
October 02, 2026.
On NQ the tempo of the movement can completely change in a few minutes.
In one moment the price moves in a narrower range, and a few minutes later after an economic data, a large corporate news or the open of the US stock market a completely different environment can develop.
At such times it is little in itself that you see the acceleration. It says much more if you can also place what changed directly before it, and whether the movement appears only in the NQ, or in other markets too.
In this article we look at what it is worth checking before the trading of the NQ, so that you better understand the market situation of the day.
Short summary
How can you know whether a fast movement is rather NQ-specific or part of a wider market repricing?
Why can a few large Nasdaq-100 companies have a large effect?
How is it worth looking at economic events and the yield of the 10-year US Treasury bond together?
Why can the environment of the NQ change at the 9:30 open of the US stock market?
What should you do with it if the factors watched by you show a different picture?
For the first step it is worth immediately stepping beyond the NQ chart itself.
1. First decide: do you see an NQ-specific movement or a wider market repricing?
Let's assume that the NQ moves powerfully in a few minutes.
Before you would look for an explanation for it, look at two things:
What is happening meanwhile with the ES?
What is happening with the yield of the 10-year US Treasury bond?
This can quickly help narrow down the possible background.
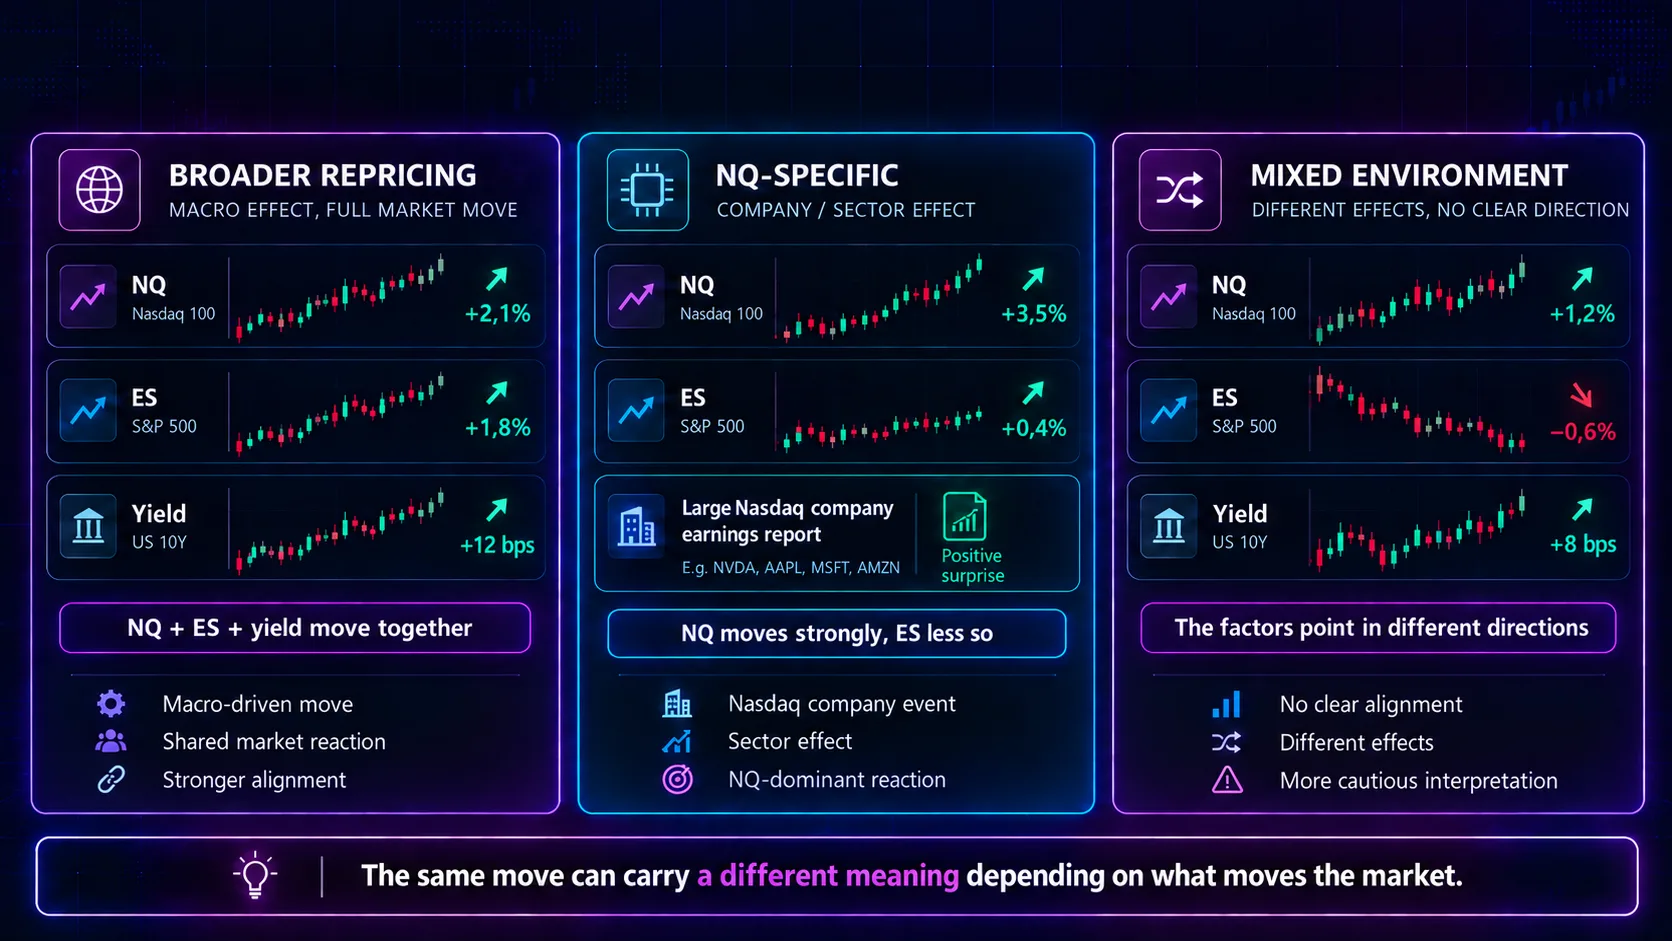
If the NQ and the ES move significantly at the same time, while bond yields also change quickly after a fresh economic data, then a wider market repricing can be taking place.
If the NQ moves much more strongly, while the ES is much calmer, it is worth looking at whether something happened around one of the large-weight Nasdaq-100 companies.
This gives a reference point to the interpretation of the movement. In itself neither connection proves what exactly caused the price movement.
The usable question is therefore this: where did the new information appear first, and which markets reacted to it?
For example:
economic data → fast change of yields → movement of ES and NQ
shows a completely different story than:
earnings report of a large Nasdaq company → strong corporate price reaction → larger movement of the NQ compared to the ES
With this you already start to isolate the source of the movement.
The next question is, why can a single company exert a visible effect on the NQ at all.
2. Because of the structure of the Nasdaq-100 a few large companies can matter especially much
The NQ follows the movement of the Nasdaq-100 index.
The Nasdaq-100 contains the largest non-financial companies listed on the Nasdaq, and its weighting uses a modified market capitalization method. Because of this the largest companies can have a much larger effect on the index than the smaller components.
Based on the December 31, 2025 data of the Nasdaq the ten largest securities of the index together represented an approximately 51.7% weight.
The weights change over time, and the Nasdaq modified the methodology of the index in May 2026 too, therefore before trading it is always worth starting from the current composition.
This goes with an important practical consequence:
a large-weight company's earnings report or strong price reaction can become visible in the movement of the entire NQ.
Therefore before trading look at:
whether any currently large-weight Nasdaq-100 company reported that day or after the previous evening's close;
whether an important forecast or other corporate announcement arrived from it;
whether an unusually large price reaction is visible in any large index component.
It is worth always checking the exact company list from the current Nasdaq-100 composition, because the weights and the order can change.
If the NQ moves significantly, the ES much less, and meanwhile one of the large index components reacts strongly to a corporate event, you already have a more specific direction of explanation.
If however multiple markets move at the same time, it is worth looking at the next layer.
3. After an economic data first look at how expectations changed
Around CPI, NFP or FOMC behind the fast NQ movement often multiple reactions building on each other are taking place.
The market already contains some kind of expectation before the event. When a new data or central bank information arrives, the market compares this with the previous expectation.
After this expectations related to interest rates can change quickly, which can appear on the bond market and the stock market too.
From the perspective of the NQ therefore the yield of the 10-year US Treasury bond can be a useful background information.
However, the direction of the yield in itself is little.
Before trading look at three things:
Which way did it move?
How large was the movement?
What happened directly before it?
For the "how large" question it is not necessary either to use a single rigid limit value. Compare the movement with the earlier yield movement of the given day, and look at whether it coincided with some important event.
A slow yield rise of several hours can indicate a different environment than a jump of a few minutes directly after an inflation data.
And if the yield rises, yet the NQ remains strong, you do not have to automatically fabricate a contradiction out of that either. At such times exactly that is the important information that the market's current reaction deviates from that simple connection to which one could count on.
Therefore use the yield as background to the interpretation of the movement of the NQ, not as an independent directional signal.
Alongside the time of the event, however, it also matters which part of the trading day you are in.
4. The 9:30 US open can change that environment in which you trade NQ
The NQ is accessible in the CME's system almost during the entire trading week. The current trading time lasts between Sunday 18:00 and Friday 17:00 according to Eastern Time, with a daily maintenance break.
The regular trading period of the Nasdaq's shares in contrast begins at 9:30 and lasts until 16:00 according to Eastern Time.
This is important because the exact same NQ can be in movement already hours before the regular open of the stock market.
At 9:30, however, the regular trading of the underlying shares begins at once, new orders get into the market, and the activity can significantly change.
The earlier Micro E-mini Nasdaq-100 data of the CME also showed that significant volume takes place in the extended period, while the larger part of the volume concentrated on the regular US trading time.
This is historical data, therefore it is not worth treating the proportions as today's constants, however it well points out that the time of day can truly mean a different activity environment.
Therefore behind a similar entry situation developing at 8:30 and at 9:35 a different market background can stand.
Therefore do not just note down the time of day as a time point. Look at what happened up to then during the day.
For example:
whether an important economic data already arrived;
how large a movement happened before the regular stock market open;
whether the volume and the price movement accelerated meaningfully after the open;
how your own earlier trades performed in this same period.
Now we already see four separate layers. The next step is that we put these together into a single usable picture.
5. In the case of multiple factors first look for what changed
This is that part which is often left out from the preparation.
You look at the economic calendar, the yields, the large companies and the NQ. The information is there, but from this the question still arises:
Which one matters truly now?
Use a simple order.
1. Find when the NQ accelerated
Mark the approximate time of the beginning of the movement.
2. Look at whether new information arrived then
Economic data? FOMC statement? Large corporate news? The open of the US stock market?
If the times coincide, you already have an examinable connection.
3. Look at whether another market reacted too
If the ES and the bond yields also move significantly, the background can be wider.
If the movement is strong mainly in NQ, look at the large Nasdaq-100 components.
4. Place the movement in the history of the day
Is it about the first significant movement?
Or the NQ already covered a large distance earlier?
Is there still an important event before you?
5. If the factors give a different picture, treat it as a mixed environment
It can happen that yields rise, the NQ is strong nonetheless. It can also be that the ES barely moves, while the NQ accelerates.
At such times multiple kinds of effects can be present at once.
It is not necessary to find a single simple story for every movement.
The usable conclusion at such times is that the background is mixed, therefore with less certainty can you tie the current movement to a single factor.
This is valuable information because it exactly shows in how clean or complex an environment you make your next decision.
A fast NQ check before trading
If you would like to carry through this entire process in a few minutes, proceed in this order:
Look at the economic events of the day and the news trading rules of your own account type.
Check whether an important event happened at any large-weight Nasdaq-100 company.
Look at the 10-year US yield and the ES, especially around a larger NQ movement.
Place yourself in the trading day: do you trade before the open, around 9:30 or later?
Sort the environment of the day into one of three groups: wider repricing, NQ-specific movement or mixed background.
This sorting does not tell which way the NQ will move next.
It is good however for you to know even before the trading in what kind of environment you evaluate the next entry situation.
Frequent questions (FAQ)
Does the NQ always fall when the 10-year US yield rises?
No. The connection can change periodically, and it matters a lot what caused the yield movement. Exactly because of this alongside the direction it is worth examining the speed, the time and the triggering cause of the movement as well.
How do I know that a yield movement is already significant?
In itself a single universal value would be little. Compare the movement to the earlier range of the day, and look at whether some important event happened directly before it. A sudden movement tieable to an event gives different information than a slow change lasting for hours.
Which Nasdaq-100 companies is it worth watching?
Primarily the companies currently possessing the largest index weight. The order and the weights can change, therefore instead of a fixed name list it is worth using the current Nasdaq-100 composition.
What if the ES, the NQ and the yields show a different picture?
Treat it as a mixed market background. At such times it is especially important to identify the exact time of the movement and the new information arriving then. If there is no clear connection, the uncertainty itself is also a part of the environment of the day.
Why is the 9:30 US open important, if NQ can already be traded earlier?
The NQ is tradable almost all day, while the regular trading period of the Nasdaq's shares begins at 9:30 according to Eastern Time. Then the full regular market trading of the underlying shares also starts, which can change the activity and the tempo of the price movement.
Summary
It is much easier to interpret the fast movement of the NQ if you first clarify three questions:
What changed directly before the movement?
Only the NQ reacts strongly, or is the repricing visible in other markets too?
Which phase of the trading day are you in?
The weight of the large Nasdaq-100 companies, the economic events, the bond yields and the time of day can all help to more exactly interpret the current situation. You get the most information out of them when you examine them in connection with each other.
This way at a fast NQ movement you can already better place in what kind of market environment it happened, and what could have changed directly before it.
If you trade with NQ, and it is important for you that you can freely follow your strategy in the periods around the large economic events too, it is worth looking at the LIMITLESS account type.
In the Eval phase there is no consistency rule, and trading during the news is also allowed, thus greater room for maneuver remains for you in the faster market periods of the NQ too.
[I look at the LIMITLESS accounts →]
The article serves an educational purpose. The presented market correlations can change over time, and none of the factors indicates securely the direction of the next movement of the NQ.