What would happen if you didn't see other traders' results for a week?
In this post

September 30, 2026.
During a single trading day multiple spectacular results can get in front of you.
Someone shares a large profit, someone shows a payout, and another publishes an especially strong trading day of theirs.
These numbers leave unchanged how you traded that day. They can, however, relocate your reference point in moments.
A +300 dollar day remains good even if five minutes later you see a +3000 dollar result.
The important question is therefore whether you would evaluate your own trading the same way if you didn't see a single other trader's result for a week?
Instead of guessing, you can also examine this with your own data.
Short summary
Why can it be misleading to directly compare two results expressed in dollars?
What happens if you measure your own entire trading history to someone else's single highlighted day?
How much information can be missing from behind a spectacular result?
How can you build a more usable basis of comparison from your own previous trades?
What can a week without other traders' results show?
You see your own entire history. From the other trader you might only see a single day.
Let's assume that you exactly know your previous 20 trading days.
You saw the better days, the weaker ones, the periods bringing little movement and those days too when a suitable opportunity for you barely or did not develop at all.
After this you see a single +3000 dollar screenshot from another trader.
Here there is already an important difference: on your own side you see 20 days of history, and on the other side you might see a single selected day.
If for example someone only shows their three strongest results out of 20 trading days, then you see merely 15% of the given period.
About the remaining 17 days you don't know anything yet from this.
There could have been weaker results, losing days, days without trading or simply more average periods.
Therefore from a spectacular result it is worth reading exactly what it truly shows: a specific result at a specific time.
About its frequency, the results preceding it and the longer-term performance further data are needed.
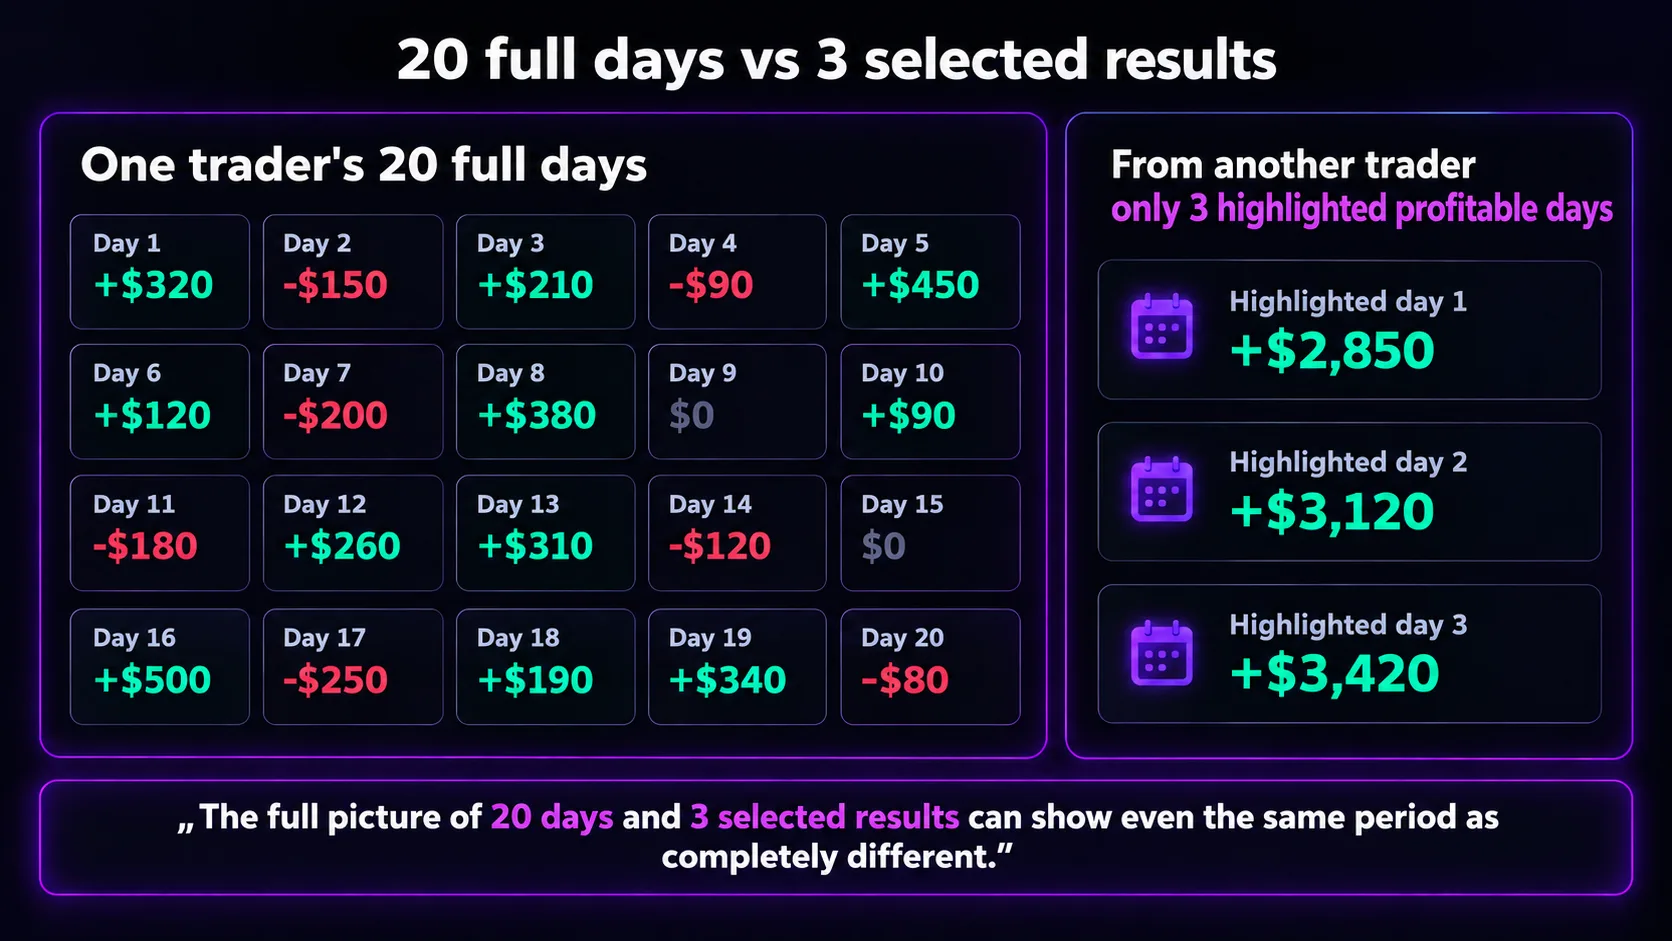
The +300 and the +3000 in itself is still little for comparison
The amount of money is spectacular, at the same time an important thing is missing from it: compared to what was it born?
Let's take a simple example.
One trader works with a 100 dollar predetermined risk per trade, and achieves a 300 dollar result.
Another achieves 3000 dollars alongside 1000 dollars of risk.
The second result in dollars is ten times larger.
Compared to the taken risk, however, in both examples the exact same threefold ratio appears.
This is naturally a simplified example, but it shows the problem:
The amount of the final result does not reveal how much risk, how many trades and what kind of framework were needed for its achievement.
At a prop firm account not even the nominal account size gives a complete picture in itself. The loss limits, the rules of the account type and the trader's own risk approach also influence what the same monetary result means.
Therefore at another trader's result four data matter especially much:
in how large a framework they traded;
how much risk they took on;
out of how many trades the result came together;
whether it is about a single day or a characteristic result of a longer period.
If these are missing, you see a number, the structure of the performance behind it, however, only partially.
One of the easiest comparison mistakes: measuring your own average day to someone else's highlighted day
Here the situation becomes truly interesting.
About your own trading you see almost everything.
You know what you did yesterday. You know last week's loss. You remember the day without trading. You see those periods too when your result was completely average.
From another trader, however, you can easily see only that one result which they shared.
This way you put two completely different patterns next to each other: your own entire distribution and someone else's single selected point.
Let's assume that out of your previous 20 days 14 results are smaller than +3000 dollars, and six are larger or similar.
A single +3000 dollar post still says nothing about whether for the other trader this was an average, rare or outstanding day.
This lack of information easily gets lost, because the final amount is immediately visible, and the distribution behind it usually is not.
This gives one of the most important lessons:
when you look at other traders' results, you often compare one result to your own entire history.
How can this become a new standard?
Let's return to the +300 dollar day.
Compared to your own previous results this could have even been a strong day.
Then you see a +3000 dollar result.
Your basis of comparison could have changed.
Instead of your own previous results, suddenly another trader's highlighted result gets next to them.
From here such new expectations can appear more easily which at the beginning of the given trading day did not yet feature.
More result.
Larger daily goal.
More exploited opportunities.
The other trader's result, however, did not give new information about your market, your own method or the quality of your opportunities that day.
It only gave a new reference point.
Therefore it is interesting to try what happens when we completely take out this external reference point for a short time.
Try it: 7 days without other traders' results
On the next seven trading days introduce a single change: before and during your trading period do not look at other traders' daily results, payout screenshots or leaderboards.
Before the experiment, however, perform a simple preparation.
Build your own basis of comparison from your previous 20 days
Gather the result of your previous 20 comparable trading days.
Sort them from the lowest to the highest.
After this divide them into three parts:
the bottom five days;
the middle ten days;
the top five days.
The middle ten days show into what range the large part of your recent period fell.
This will be the next week's own basis of comparison.
If meanwhile your account, your trading method or the taken risk framework changed significantly, choose such previous days which are truly comparable with the current ones.
Now at the end of every new trading day you only have to look at a simple thing:
where is today's result located among your own previous 20 days?
In the bottom range?
In the middle range characteristic for you?
Or among the stronger days of the past period?
With this you position your own result to your own recent data.
Why does this give more information than another trader's result?
Let's continue to assume that a given day of yours is +300 dollars.
Next to a social post this can easily seem small.
Compared to your own previous 20 days, however, it can turn out that the +300 dollars belongs among your stronger days.
Or exactly the opposite turns out: compared to your own recent results it was indeed a weaker day.
In both cases you work with more information, because the comparison starts from the results of the same trader, born under similar circumstances.
This still does not tell whether a given trade was a good or bad decision.
It is usable, however, for you to get a more exact picture about what actually counts for you as an unusually strong, usual or weaker result.
This gives a completely different basis than an amount published with an unknown background.
What to look at at the end of the week?
After seven days compare your new results with your previous 20 trading days.
Look at:
How many days of yours brought a similar result to what you experienced in the large part of the previous 20 days?
How many days were expressly strong compared to your own previous results?
How many days were weaker compared to your own recent past?
Do you see differently after these what counts for you as an average, strong or weaker trading day?
Here a realization can be especially interesting:
what would seem little next to a +3000 dollar screenshot, among your own results can even be an expressly strong day.
The same can be true the other way around too.
By the end of the week this way you will already have a basis of comparison developed from your own data, to which you can measure your later results too.
This is important because you will have your own data series to which you can look back.
If a day seems weak, you can look at whether it truly deviates from your own results.
The same is true for the strong days too: you will see whether for you it is really about a rare result, or part of your own accustomed range.
This way over time you can increasingly accurately interpret your own performance based on your own trading history.
What is worth keeping after the week?
The results originating from other traders can continue to give interesting information.
A payout can show that a specific payout happened. A detailed trading report can show how someone thought in a given situation. And a multi-month record can already give much more correlations than a single strong day.
The key is that you draw exactly that conclusion from them which the given evidence truly supports.
Frequent questions (FAQ)
Do I have to completely avoid other traders' results?
No. The seven-day experiment is a test for you to observe what effect other traders' results have on you.
These contents can give useful information or motivation too, at the same time as external reference points they can influence how you evaluate your own performance.
The goal of the experiment is that you can observe this effect in your own trading.
What happens if my risk framework changed meanwhile?
At such times it is worth examining such previous days together which were born among similar frameworks. Alongside a significantly different account size or risk approach the comparability of the raw monetary amounts decreases.
Summary
At other traders' results often only the final number is visible.
From your own trading in contrast a full series stands before you: strong days, more average periods, weaker results and days without trading alike.
Therefore a disproportionate comparison can easily come into existence: your own entire history gets next to someone else's single highlighted result.
The 7-day experiment makes this more visible. Out of your own previous 20 trading days you create a personal basis of comparison, then for a week you position your new results through this.
This way you can increasingly exactly see what truly counts as an unusually strong or weaker result in your own trading.
If you already see the operation of your own strategy more clearly, it is worth choosing such an account type whose rules fit to this.